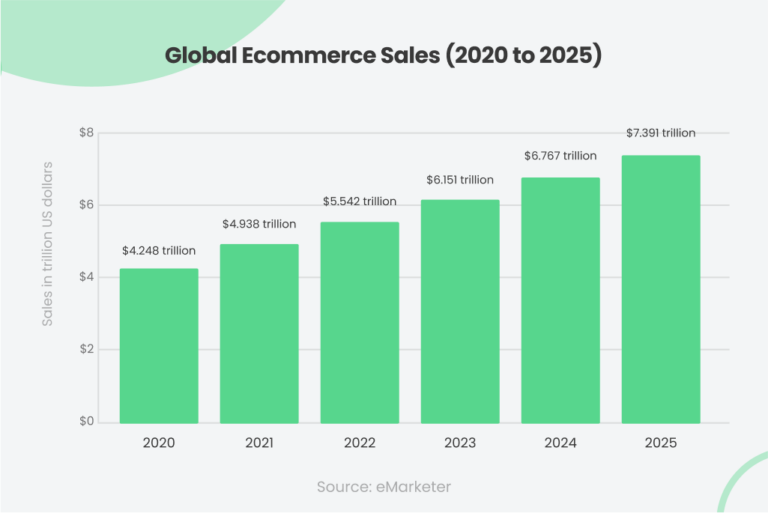
The eCommerce market is growing at an astonishing rate. In 2022, global eCommerce sales are expected to reach a whopping $5.5 trillion. In today's fiercely competitive market, it’s important that your business not only attracts new customers but keeps them coming back for more.
The question is how to achieve it. The first step is to understand which eCommerce KPIs to track.
It might be challenging to understand which KPIs really matter in the long run. The wrong KPIs can lead to wasted time, money and other resources that would have best been directed elsewhere.
In this guide, we’ll explain how to choose the right KPIs for your eCommerce business. You’ll find answers to such questions as:
- What are eCommerce KPIs?
- What eCommerce KPIs should you to track?
- How to choose KPIs for your eCommerce business?
- What are the best tools for tracking eCommerce KPIs?
So without further ado, let’s get started!
What are eCommerce KPIs?
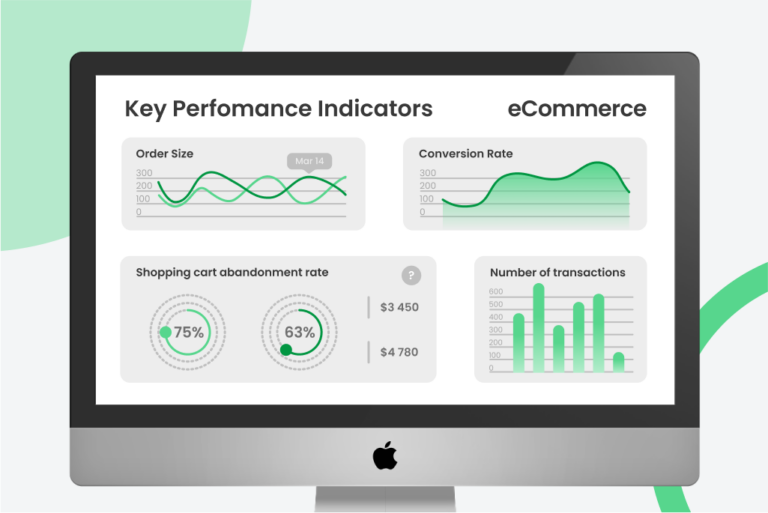
eCommerce KPIs (Key Performance Indicators) are sets of quantifiable measures used to analyze the performance of business operations over a set period of time. They offer insight into how well your efforts are working.
KPIs can be used to measure the success of your eCommerce strategy, as well as for troubleshooting and adjusting course when needed. The problem is that there are hundreds of KPIs to choose from. Where should you focus your attention?
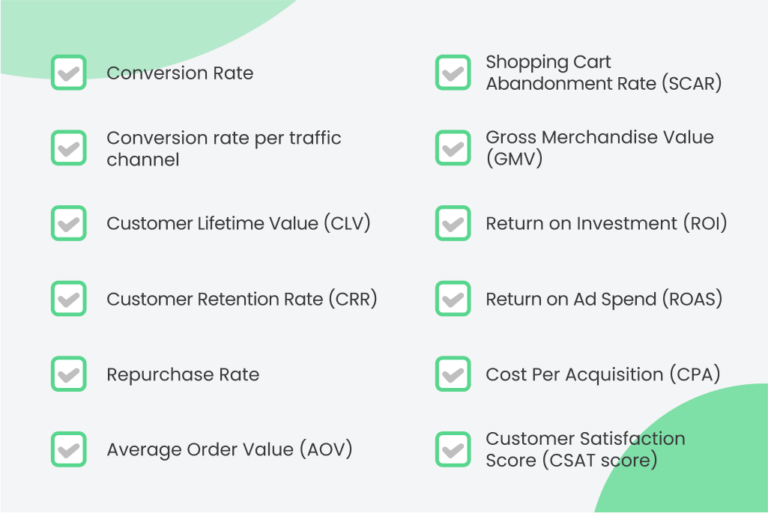
We’ve worked with hundreds of businesses, and put together a comprehensive list of KPIs that eCommerce businesses should be tracking. These KPIs will give you a solid understanding of how your business is doing, as well as where there is room for improvement.
Want to know about common eCommerce business development misconceptions?
Read our article 8 Business Development Myths for eCommerce Store Owner
eCommerce KPIs to Track for Max Sales
As an eCommerce business owner, you probably spend your days (and nights) thinking about how to get more sales. Let’s explore the most important eCommerce KPIs that can provide valuable insights into your business’s inner workings:
-
Conversion rate
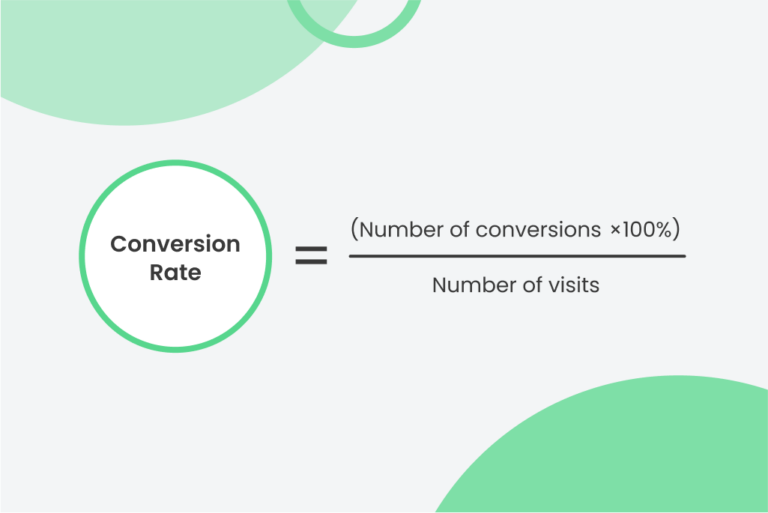
Definition: Conversion rate is the percentage of customers who took an action out of all those who visited your store. So if you sell laptops, and you get 100 people visiting your website and 20 of them buy laptops, then your conversion rate is 20%. You can check conversion rate to understand how well your marketing efforts are working and make adjustments as needed.
How to calculate: Divide the number of orders by total traffic and multiply it by 100.
How to improve: If you want to increase your conversion rate, you need to know why people aren’t converting. This could be because they don’t see any value in what you’re offering, they don’t trust you, or they aren’t convinced that they’ll be able to accomplish what they want with your product. There are a few things that could help, such as improving your product, the design of your store, making it easier for people to find what they’re looking for, etc.
-
Conversion rate per traffic channel
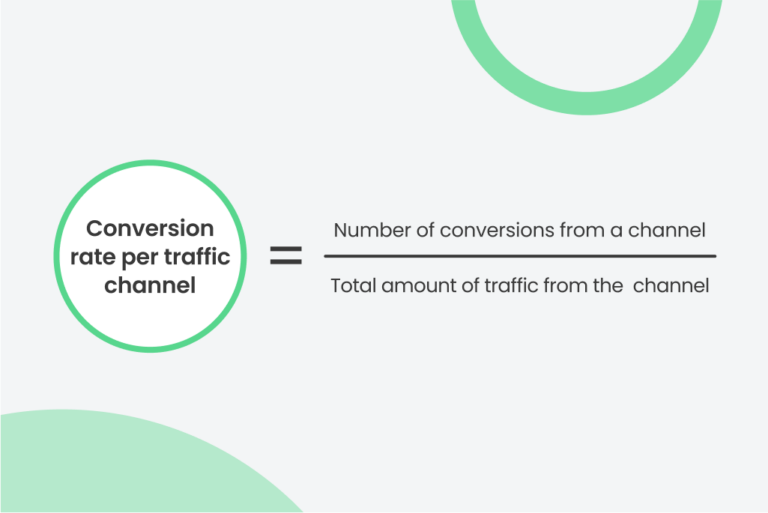
Definition: Conversion rate per traffic channel is the percentage of people who converted on your store after visiting it through a specific traffic channel. It helps understand which channels are driving the most conversions. This KPI can be used to compare the performance of different traffic sources and determine whether you should invest more in certain channels or stop advertising there altogether.
How to calculate: Take the number of conversions from that channel and divide it by the total amount of traffic from that channel.
How to improve: The first step is understanding where you are currently performing well and where you are not. Once you have identified which channels have the lowest conversion rates, it’s time to determine what can be done to improve them. Analyze your sales funnel — the series of steps that users take before they make a purchase — and consider how you can make it more effective. The most important thing you can do is to ensure that all of your traffic channels are being optimized for conversions.
-
Customer Lifetime Value (CLV)
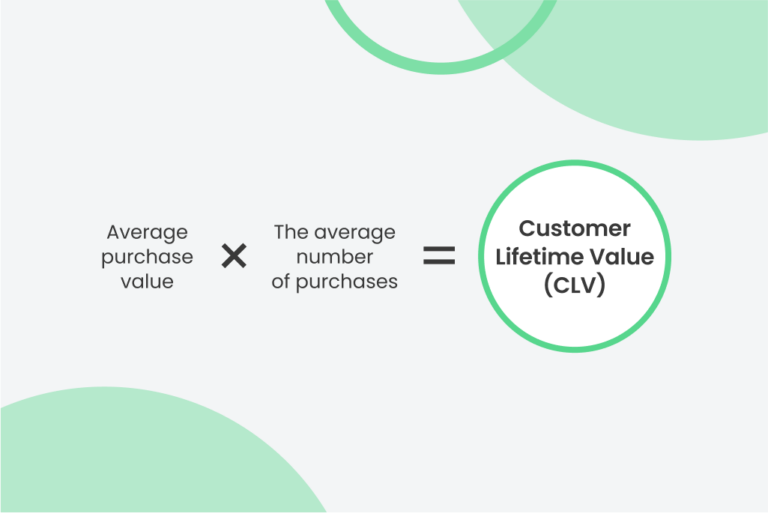
Definition: Customer lifetime value (often referred to as CLV, CLTV, or LTV) is used to measure the amount of revenue a client helps to generate over the course of their relationship with your company. It takes into account every single purchase a customer makes, from their very first order to their most recent transaction.
How to calculate: Count the average purchase value and multiply that number by the average number of purchases.
How to improve: The best way to improve your customer lifetime value is to focus on the customer experience. You can increase CLV by providing good service, great products, and competitive prices. If a certain category or brand has high CLVs, it might be time to expand into other related areas like accessories or additional colors/styles in order to capture even more sales.
-
Customer Retention Rate (CRR)
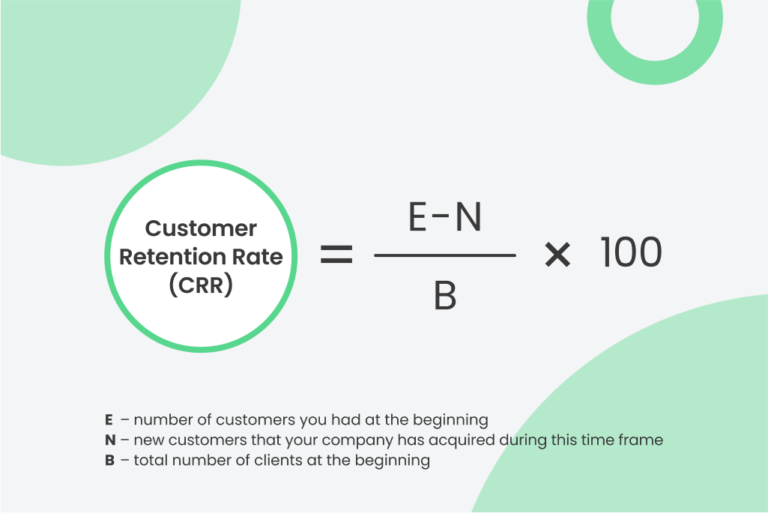
Definition: Customer Retention Rate is the percentage of customers who remain loyal to the brand. It’s crucial for companies to monitor their customer retention rates to see if consumers are coming back — and to determine what’s driving them to stay or pushing them to leave.
How to calculate: Take the number of customers you had at the beginning (E), subtract the new customers that your company has acquired during this time frame (N), divide the resultant number by the total number of clients at the beginning (B), and multiply this fraction by 100. Customer retention rate: ((E-N)/B)*100
How to improve: Make sure that your customers feel like you listen to them and they are valuable for your business. Show clients that you care about them, make sure they have a positive experience every time they interact with someone from your company, and respond quickly when they have questions or concerns.
-
Repurchase rate
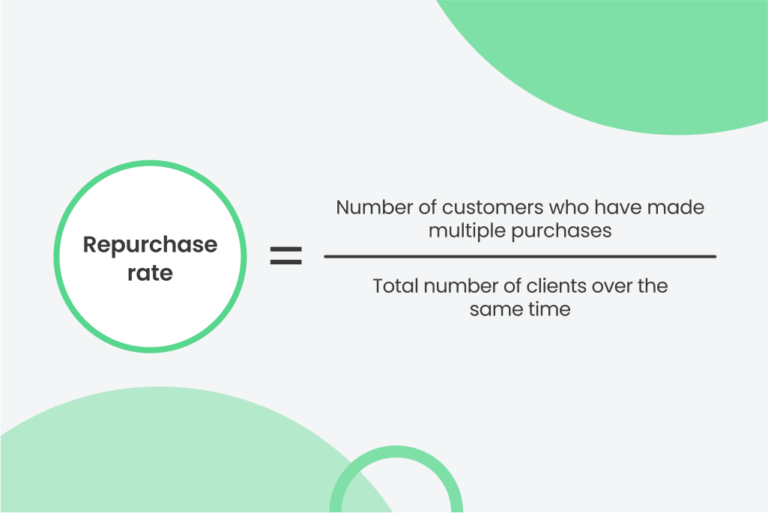
Definition: Repurchase rate (aka repeat purchase rate) is the percentage of customers who have purchased more than once from a company within a specified time period. It’s a way to measure customer loyalty and retention, as well as how many people are likely to buy from you again. Repurchase rate can provide insight into how well your company is doing at retaining customers.
How to calculate: Divide the number of customers who have made multiple purchases by the total number of clients over the same time.
How to improve: Companies that want to improve their repurchase rate should focus on improving customer satisfaction. It could be done through providing excellent customer service and offering discounts for repeat purchases. And this goes without saying — make sure that products meet expectations in terms of quality, value, and durability. As of 2022, there has been increased focus on customer retention. That’s because attracting new customers is becoming increasingly more expensive and difficult. Online stores are rethinking their business models and trying to build deeper relationships with existing customers through loyalty programs, rewards points, personalized recommendations through AI/ML technologies, etc.
-
Average Order Value (AOV)
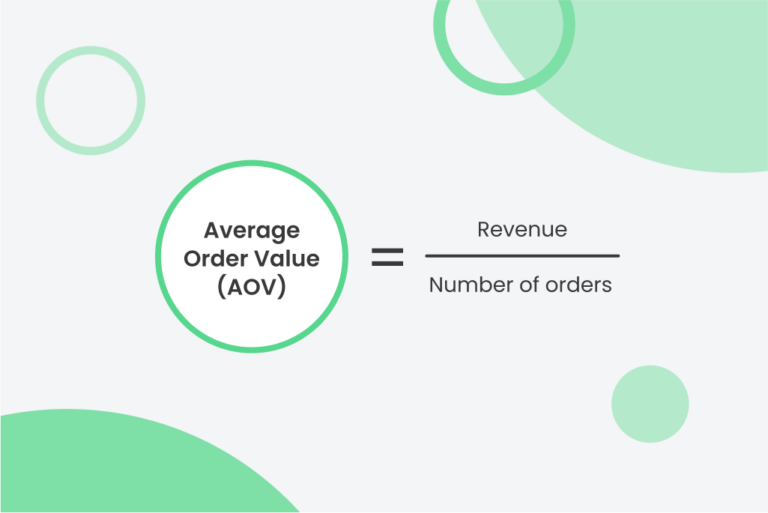
Definition: Average Order Value is the average value of all orders placed during a given time period. AOV measures the revenue potential of your business, and it can be used to refine your marketing strategy.
How to calculate: Divide the total revenue by the total number of orders.
How to improve: One of the most effective ways to increase your AOV is through upselling. Upselling is when you offer customers an additional product or service that could be beneficial for them. For example, if someone buys shoes from your store, you might suggest purchasing insoles. You can also use cross-selling tactics. For example, when someone buys a pair of shoes, you could recommend they also purchase shoe polish.
-
Shopping Cart Abandonment Rate (SCAR)
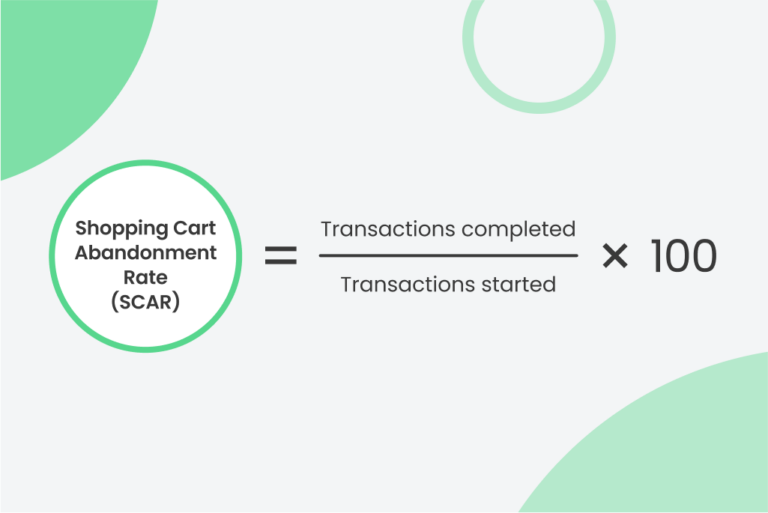
Definition: SCAR is the percentage of visitors who add an item to their shopping cart but do not complete the purchase. This can be caused by several factors — from the customer’s perception of value to poor navigation and design. For example, some shoppers may abandon their carts because they are unable to complete the purchase due to technical issues on your site. Others may abandon their carts if they feel that the price is too high.
How to calculate: SCAR is calculated by dividing the total sales by initiated sales, multiplied by 100.
How to improve: Shopping cart abandonment is a major problem for online retailers. According to a study by Baymard Institute, 69.82% of shoppers leave items in their shopping carts. There are several ways retailers can reduce shopping cart abandonment rate, such as offering free returns, providing accurate product information, and making the checkout process as seamless as possible. Or perhaps you’ll need to make your shipping policies clearer so that customers know how long it will take to receive their orders. One of the key reasons why customers leave a website without making a purchase is because of issues with the checkout process.
Do you want to make it easier for your customers to complete their purchase? Watch this video to find out how to optimize your checkout process.
-
Gross Merchandise Value (GMV)
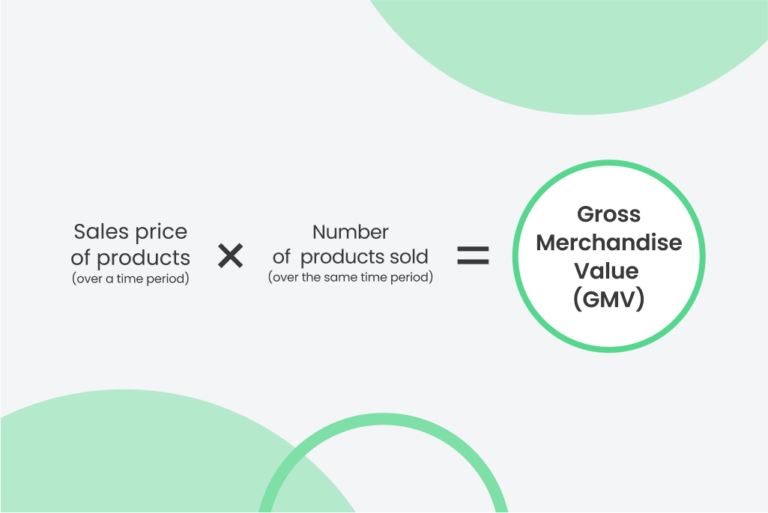
Definition: Gross Merchandise Value is a measure of the total value of goods sold in a given period. The GMV figure is used as a way to measure the success of an eCommerce business — it shows how well a company is doing.
How to calculate: Multiply the total number of goods sold by their sales price in a given period.
How to improve: The most important thing about increasing your GMV is that it should be done in a way that allows your company to remain profitable while still offering good deals. Try to increase engagement with your customers by communicating with them regularly, discount old and excess stock, and expand your reach by offering international shipping options.
-
Return on Investment (ROI)
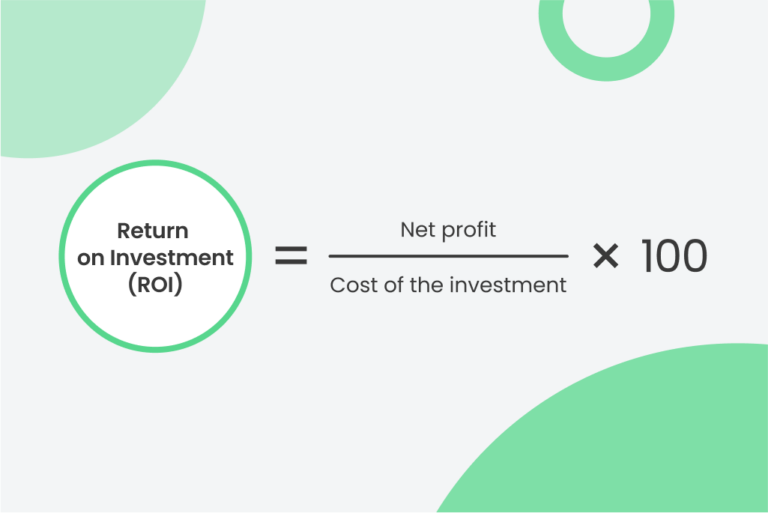
Definition: ROI is the metric that shows the profits generated by a specific marketing campaign or channel. It compares the amount you spent to the amount you earned.
How to calculate: ROI = Net profit / Cost of the investment * 100
How to improve: The road to higher ROI is paved with better data. You can start by identifying high-value customers and rewarding them with loyalty programs or special offers. And by using data from past purchases, you can create personalized shopping experiences.
-
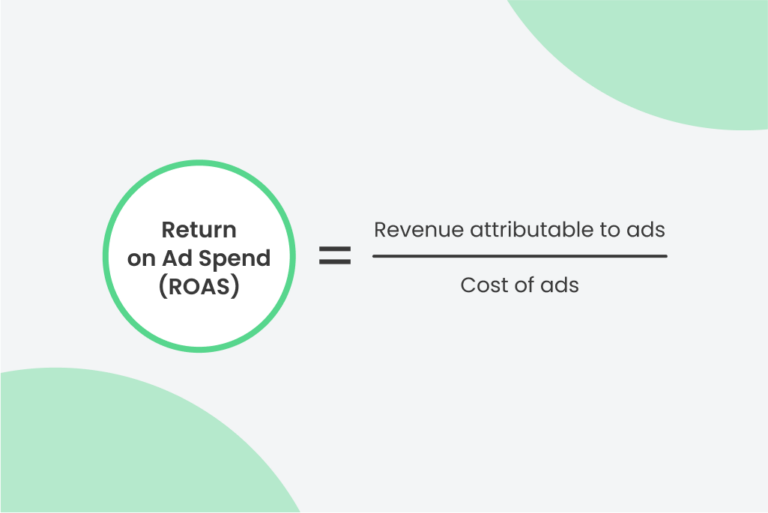
Return on Ad Spend (ROAS)
Definition: Return on Ad Spend is a measurement of your marketing’s effectiveness. It compares the revenue generated from a campaign to the amount spent on that campaign. ROAS helps you understand whether you’re getting your money’s worth from your marketing efforts.
How to calculate: ROAS = Revenue attributable to ads / Cost of ads
How to improve: One great way to improve your ROAS is by using retargeting ads. Retargeting allows you to run ads for people who have already visited your store and are highly likely to buy again. This boosts your ROAS because it means you are spending less money on new customers and more on repeat ones, meaning you get more value from every dollar spent on advertising.
-
Cost Per Acquisition (CPA)
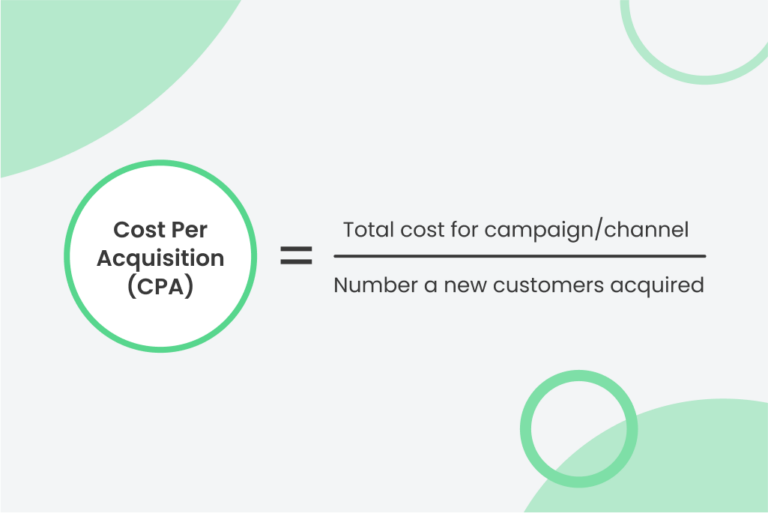
Definition: Cost Per Acquisition measures the cost to acquire one paying customer on a campaign/channel level. The reason why CPA is so important is because it helps companies understand how effective their marketing campaigns are at generating sales.
How to calculate: Divide the total cost by the number of new customers acquired from the same campaign/channel.
How to improve: The main idea behind CPA is that, in order to have a sustainable business, companies should not spend more money on marketing than they earn from it. There are several things that you can do to improve cost per acquisition: change the type of ad being shown to users, run more targeted ad campaigns that are specific to each type of target audience, and increase the quality of landing pages.
-
Customer satisfaction score (CSAT score)
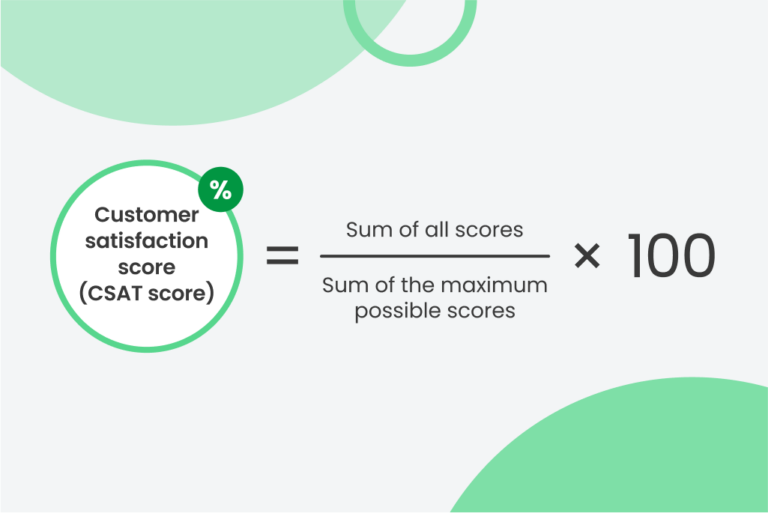
Definition: CSAT score determines how happy customers are with a company’s offerings. It’s calculated by sending a survey to the customer after a purchase or support interaction.
How to calculate: CSAT Score (%) = (Sum of All Scores) ÷ (Sum of the Maximum Possible Scores) × 100
How to improve: It’s true that customer feedback is essential for improving your business, but it’s also true that customers are not always going to be happy with their experience. The key is finding out why they aren’t satisfied and then resolving it so that everyone walks away happy. It is not just about whether they would buy from you again — it’s also about whether they would recommend you to others.
How to Choose KPIs for Your eCommerce Business?
As Albert Einstein said, “Not everything that can be counted counts, and not everything that counts can be counted.”
Not all key performance indicators are equally important to the success of your eCommerce business. Here are some things to consider when choosing your KPIs:
-
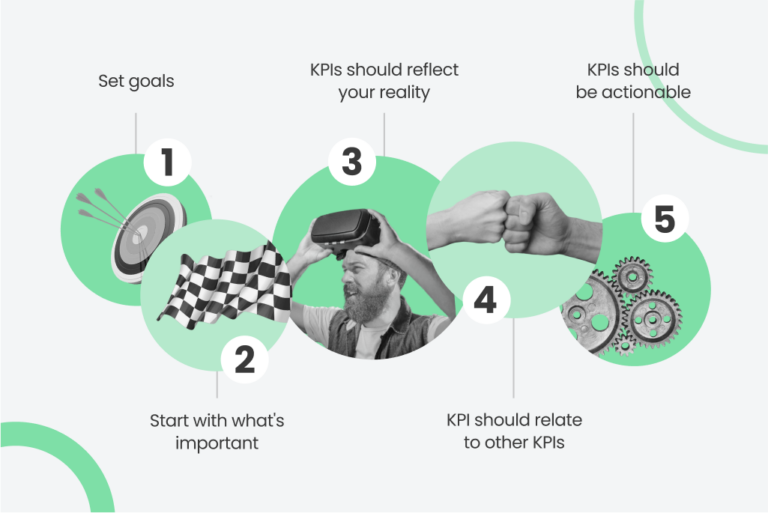
Set goals
The next step is to determine what your goals are — both long-term and short-term. These goals should be clearly defined so that you know exactly what you’re aiming for when analyzing these KPIs. For example, if your goal is “double customer satisfaction rate by 2024,” then it would make sense to set up a KPI that measures customer satisfaction each year so that you can see how close or far away from this goal you are currently operating at (and whether or not progress is being made).
-
Start with what’s important
It’s tempting to want to know everything about your business. However, keeping track of too many KPIs can easily overwhelm you and make it harder to focus on the most important ones. When it comes to choosing KPIs for your eCommerce business, there are two things that matter most: revenue and customer satisfaction. Without those two things, a company cannot survive. So start by looking at those two metrics and then move on from there.
-
KPIs should reflect your reality
It is important to choose KPIs what’s most relevant to your business. Don’t worry about making sure every KPI looks exactly like another company’s — the most important thing is that it makes sense for your business and helps you achieve your goals. KPIs can be quantitative or qualitative — it doesn’t matter which one you choose as long as they’re accurate and help you understand how the business is performing.
-
KPI should relate to other KPIs
KPI should always relate to other KPIs in order to be effective. It will help to provide a holistic view of the company’s performance. If you want to measure the health of your business, you need to look at how all of your KPIs are performing together. For example, if you want to improve your marketing strategies, you could make sure that you are also improving your customer service and product quality. You can also use eCommerce video marketing to boost sales or content marketing to tell more about your product or service. This helps ensure that you are not just focusing on one area at the expense of others.
-
KPIs should be actionable
Most importantly, make sure your KPIs are helping you understand the improvements you need to make. If you use KPIs as a tool for improvement, it’ll be much easier to keep up with your growth goals. They should be clear, concise, and easy to understand by both you and your team.
If you’re selling products online, it’s easy to get caught up in the numbers. But not all KPIs are created equal, and not all of them will help you reach your goals. It’s important to know what each KPI means and how it relates to other KPIs to be sure you’re tracking the right things for the right reasons.
The Best Tools for Tracking eCommerce KPIs
When it comes to tracking eCommerce KPIs, there are a lot of tools on the market. Here’s a quick rundown of the best tools for tracking your eCommerce KPIs:
-
Google Analytics
Google Analytics is a tool from Google that allows you to track all kinds of information about your traffic and sales. It’s free and easy to set up. Google Analytics has a ton of features that can help you understand your customers. You’ll be able to see which pages are most popular, what devices your visitors use, how much time they spend on each page, etc.
-
Semrush
Semrush offers an array of features to help you analyze the performance of your marketing campaigns and optimize them accordingly. The software can be used by marketers of all levels, from beginners to advanced professionals.
-
Amplitude
Amplitude is one of the best eCommerce analytics tools present in the market. It gives businesses instant insights into what’s working — and what’s not — so teams can make meaningful changes. The platform offers detailed analysis of user behavior, which helps understand different types of audiences.
-
Glew
Glew is an all-in-one eCommerce analytics tool for stores hosted on Magento, Shopify, and WooCommerce. It offers customer insights, merchandise analytics and performance reports. Glew provides powerful insights that help business owners make the right decisions at the right time.
It can sound daunting to analyze data if you’re new to eCommerce, but with the right tools, it’s easier than ever. In fact, if you don’t analyze your data regularly, you could be missing out on opportunities to improve your customer experience, increase sales, and cut costs.
Planning to build an eCommerce business? We offer a complete suite of Magento development services that ensure an unparalleled shopping experience. Contact our experts to get all your questions answered.
Final Thoughts
Well, there you have it. Crucial eCommerce KPIs to track as an online retailer in 2022. With these KPIs and the improved visibility into your marketing performance, you can make more informed decisions for your business and use your resources more effectively.
As a business owner, you have a lot to juggle, from managing inventory and refunds to inventory control and fraud protection. However, it’s extremely important to revisit your KPIs regularly and compare them to industry benchmarks so that you can see how well you’re doing compared with other businesses in your industry.
We hope this guide has been helpful to you. Keeping track of all of your marketing data can be overwhelming, but it is important to stay on top of it. If you have any questions about eCommerce KPIs, feel free to reach out to us at [email protected]


